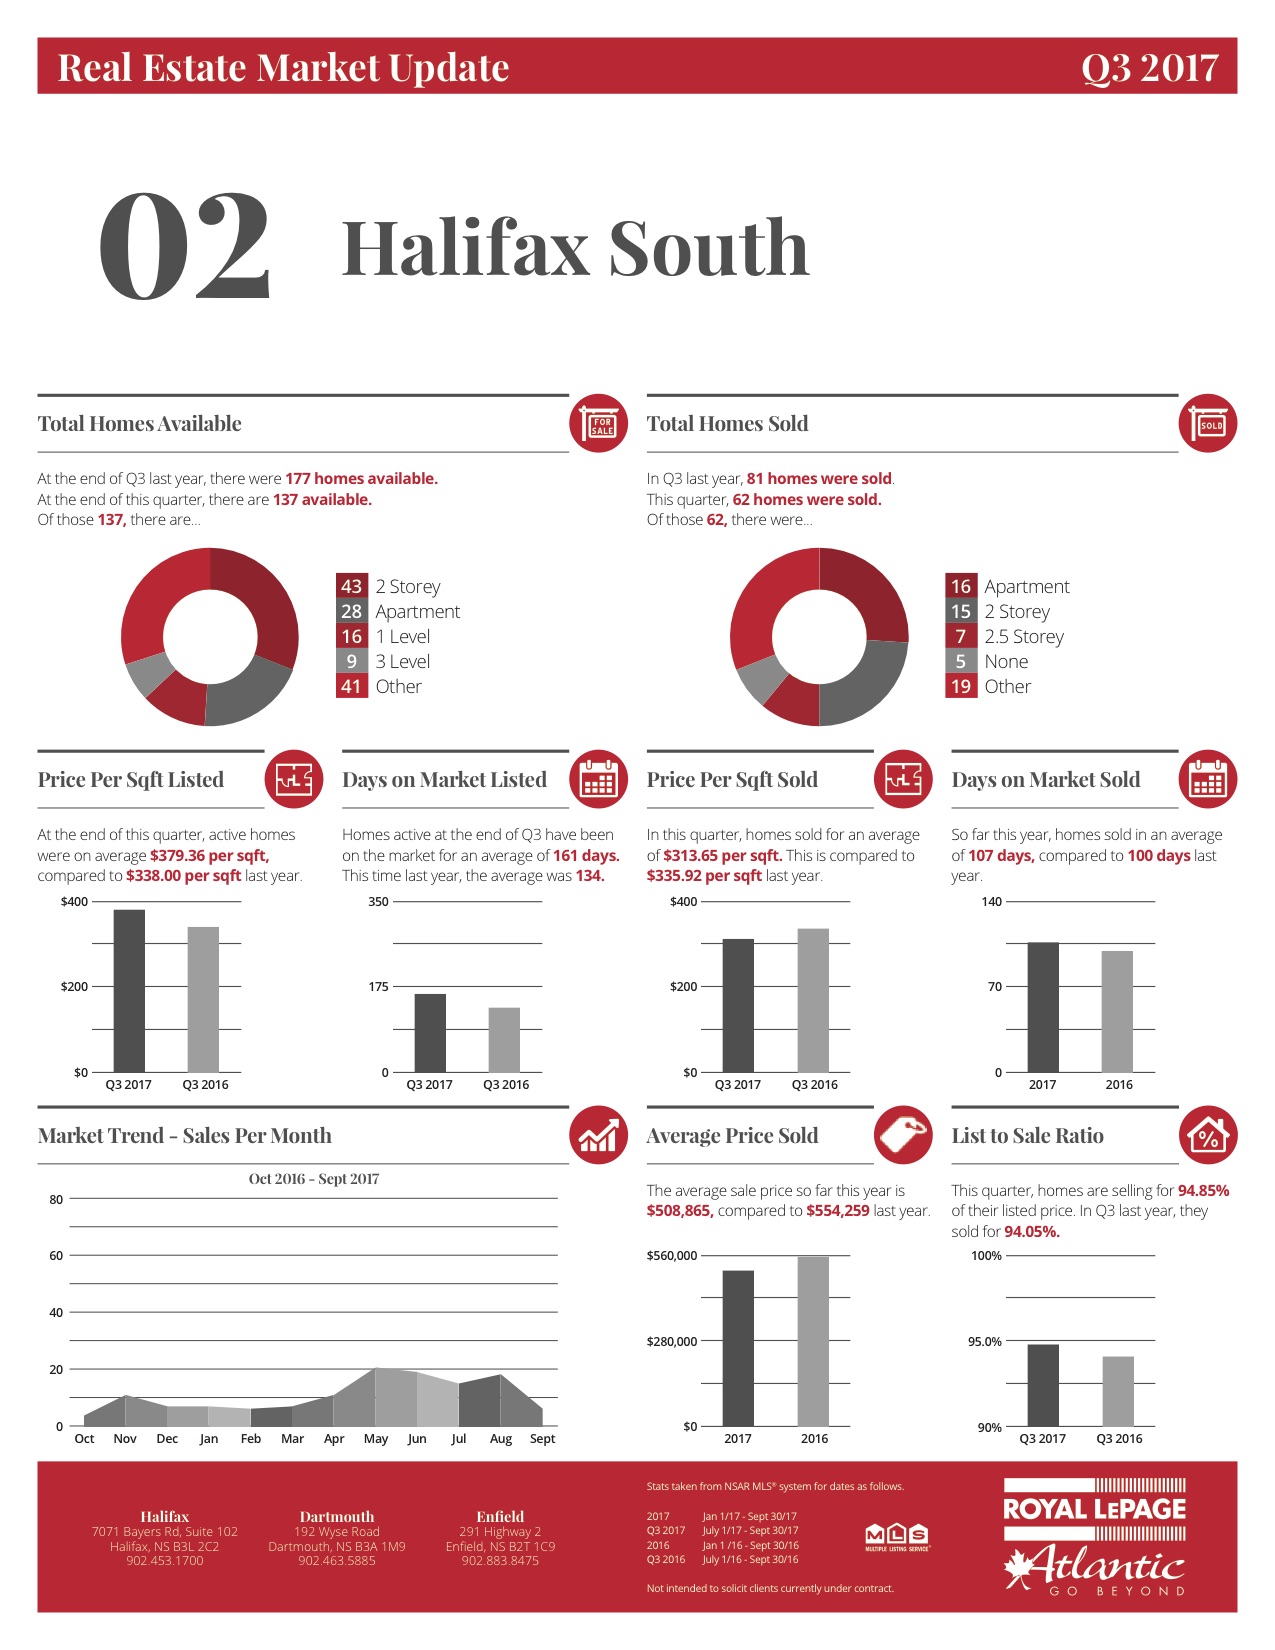
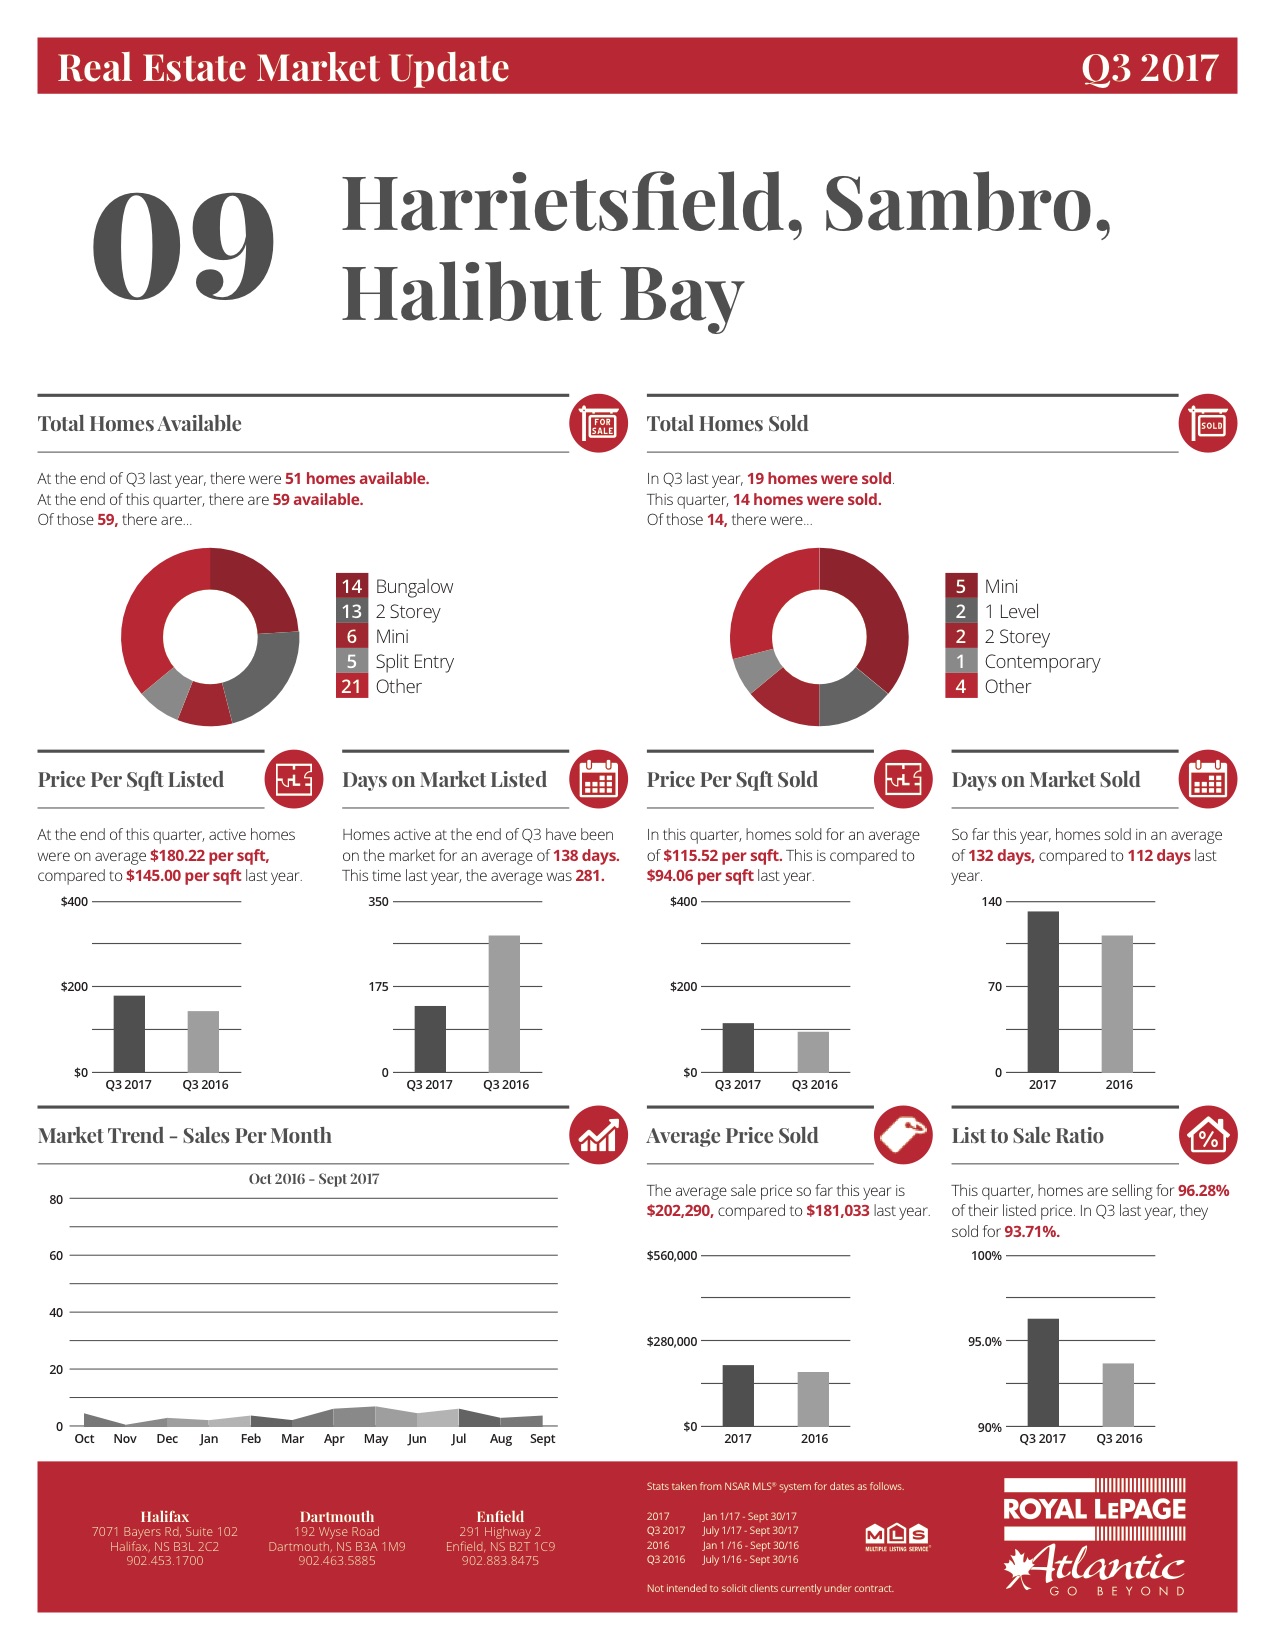
Halifax Sales Statistics, 3rd Quarter
These latest Halifax Sales Statistics show us the seller’s market continues to improve for the 4th straight year. Here are the 3rd quarter numbers, compared to this time last year, broken down by neighbourhood. Have a look at yours, you may be surprised! We are seeing price increases in all areas, plus slightly fewer homes on the market, compared to last year. The time it takes to sell has improved as well, as have the selling prices as a percentage of the asking prices. We are approaching a “Balanced” market, where the number of sellers and buyers are roughly equal, unlike the last few years when the sellers outnumbered the buyers, creating an over-supply situation. This, combined with the tougher mortgage lending rules and the threat of higher interest rates, means buyers are starting to feel some urgency to act more quickly. These new changes will effect first time buyers, who are already having difficulty finding affordable homes in the most desirable areas of Halifax Regional Municipality (HRM). In most areas of HRM, the price increases in the last 12 months easily exceeded the inflation rate, good news if you consider your home as a long term investment. Even at a 3% annual growth in value, your investment in your home is a good, safe one, especially if you have a low interest mortgage in place. For example, if your home’s growth in value only increases by, let’s say 3%, and your 75% mortgage has an interest rate of 2.5%, you are effectively earning 4.3% on your 25% downpayment equity, usually income tax free. Plus you get to live in & improve your investment while it grows! Compare that with the taxable return on your savings account! Curious about your home’s market value? Get a Comparative Market Analysis here by email!
Halifax Sales Statistics have you wondering what your home is now worth, click here to find out by email.


